




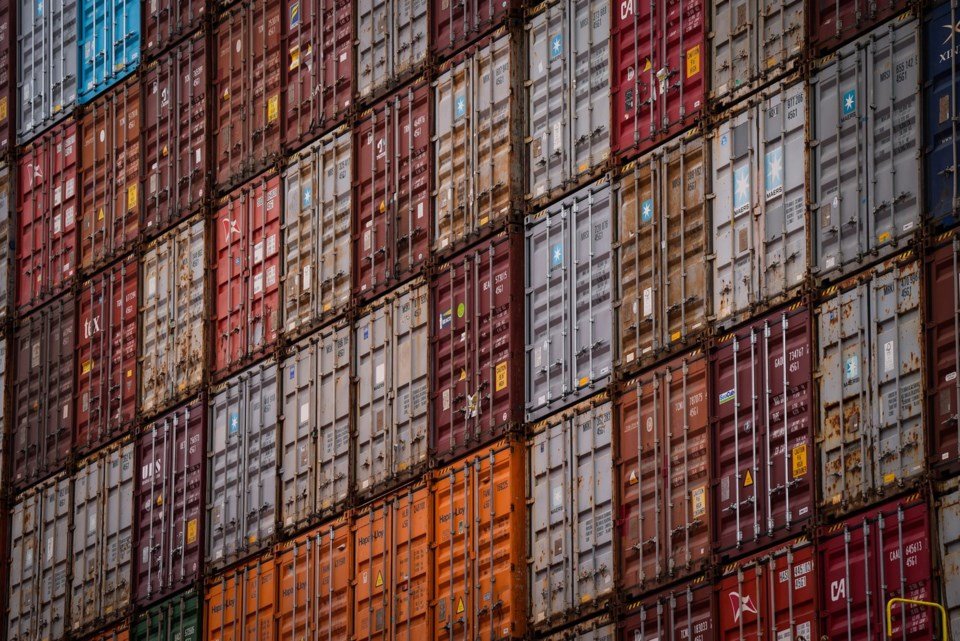
Global container shipping continued to grow in August with volumes reaching a record 17.46 million twenty-foot equivalent units (TEUs), even as freight rates rose to their highest level in more than two years, according to Container Trades Statistics (CTS).
The August total was ahead of the previous record in July and up 3.7% on August 2025. Global container volumes rose 4.7% year on year in the first eight months of 2026, according to a report by CTS published Oct. 8.
The figures show that international container trade continues to demonstrate resilience despite a challenging operating environment marked by high fuel prices, disruptions in the Arabian Gulf, Panama Canal restrictions and changing tariff conditions. Volumes for August were 7.2% above the levels of August 2024 and 12.9% above those of August 2023.
Freight rates rise to highest since July 2024
This increase in container volumes has been reflected in a steep increase in freight pricing. The CTS Global Price Index gained two points in July to 117 in August, its highest level since July 2024 when shipping prices were under heavy pressure from Red Sea disruptions.
The index was about 50% higher than it had been in January 2026 and 44% higher than it had been in August 2025.
“Pressure on prices has been building since late February,” says CTS. Disruptions to key shipping routes have forced carriers to change vessel movements, affecting available capacity and increasing operating costs as ships are rerouted.
The simultaneous increase in volumes and prices reflects the pressure on container shipping markets as carriers face operational disruptions and changing trade dynamics.
North American container imports continue to recover
During the first eight months of 2026, North American container imports grew 2% compared with the same period last year. The result extends a modest rebound begun in May, following negative year-to-date growth earlier in the year.
The improvement has been aided by higher cargo flows from Asia. Year to date, trans-Pacific trade has grown 5%, a big bounce-back from earlier weakness related to tariff uncertainty and extreme congestion at ports of origin caused by typhoons.
The recovery bodes well for North American import activity, although trade flows remain susceptible to uncertainty from policy shifts and interruptions to shipping operations.
The report’s regions with the strongest percent increase in imports were sub-Saharan Africa. Volumes rose 13% in the first eight months of the year with growth coming from most of its major origin markets. The only notable exceptions were the Indian Sub-Continent and the Middle East.
Indian Sub-Continent and Middle East – Record falls
Indian Sub-Continent and Middle East was the only region to record a year-to-date decline in imports with volumes down 5%.
It was also the only region with a fall in exports. Outbound shipments declined 10% or almost one million TEUs compared to the first eight months of 2025.
Uneven global container trade recovery highlighted by regional disparities. Some markets are seeing a growth in cargo flows while others continue to see a contraction in import and export activity.”
Far East remains export growth engine
Year-to-date, exports from Asia were up 8% representing an increase of about 6.3 million TEUs over the same period in 2025.
Cargo from the Far East increased in all destination regions. The biggest percentage gains were in sub-Saharan Africa and South and Central America, showing the increasing penetration of Asian export flows.
European exports also seemed to be settling down. Export volumes, which had declined earlier in the year, returned to around flat year-to-date growth supported by stable or improving cargo movements to most destination regions.
Asia’s export performance remains a major contributor to the overall growth of container shipping, helping to compensate for weaker performance elsewhere in the global market.
Slower monthly growth raises questions for the final quarter
While the record volume was achieved in August, CTS cautioned that the month-over-month growth rate appears to be decelerating. That could be a sign of slowing demand as the industry heads into the final quarter of 2026.
The outlook therefore combines the ongoing growth in global container movements with high freight rates and ongoing operational uncertainty. Fuel costs, disruptions on important shipping lanes, canal constraints and changing trade policies continue to be key factors affecting capacity and pricing.
The big question for carriers, shippers and logistics providers will be whether demand can maintain its momentum through the final months of the year while freight rates stay well above their levels at the start of 2026.