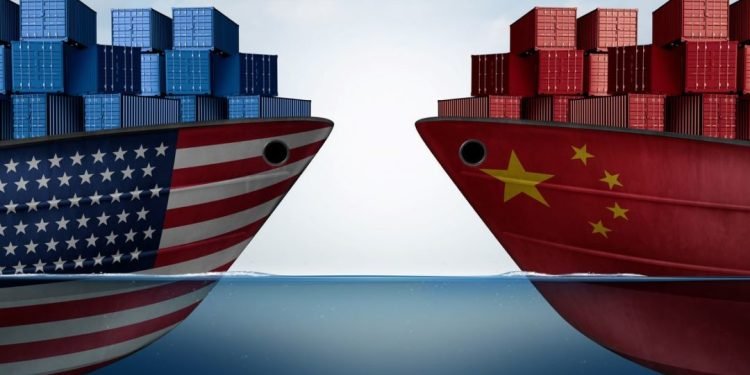
The marginal shifts in the proportion of U.S. containerized imports originating from China and other nations align with three prominent sourcing trends acknowledged by both the business and geopolitical sectors: the China Plus One strategy, incremental friendshoring gains in terms of volume, and a growing reliance on Vietnam, while India emerges as a significant player in the supply chain landscape.
Retailers in the United States and other businesses want to reduce their dependency on China by looking for labor at a lower cost and reducing the risks associated with using a single supplier for essential items. The percentage of Chinese imports into the United States has consistently decreased, with the exception of a brief increase in 2021 when merchants went back to their long-standing trading partners.
For China, there has been a discernible change in the last five years. China was the source of 47% of the loaded containerized imports entering the United States in 2018. But by last year, according to statistics from PIERS, this percentage had decreased to 39.6% from 40.7% in 2022. The percentage of Taiwanese imports into the United States decreased by 0.2 percentage points during the same time, ending at 2.5%.
By 2023, South Korea, Japan, and Germany accounted for a greater share of U.S. imports, indicating a change in the friendshoring policy. South Korea saw the most gain of any trading partner of the United States, rising from 4.1% in 2022 to 4.7% in 2023. Germany had minor increases in its percentage of U.S. imports, going from 3.9% in 2022 to 4.1% in 2023, despite difficulties in its industrial sector. In a similar vein, Japan’s import percentage to the United States rose throughout that time, from 2.3% to 2.5%. This trend indicates that American shops and companies should diversify their sourcing areas outside China.
Despite China’s declining share, Vietnam, the second-largest source of U.S. containerized volumes, maintained its share of U.S. imports at 8.7% between 2022 and 2023. This stability in Vietnam’s import share suggests a sustained position as a significant manufacturing alternative to China. However, some observers caution that this could signal Vietnam approaching the peak of its production capacity. Nevertheless, Vietnam has demonstrated a consistent and robust growth trend, surpassing other manufacturing alternatives like India, more than doubling its share since 2013 when it stood at 3.3%.
India’s gradual emergence as an alternative to China in the sourcing landscape is evident in the PIERS data. Over the past year, the share of U.S. imports from India increased to 4.1% from 3.9%. While this growth is notable, it has been slower compared to Vietnam’s ascent. India has only managed to surpass the 3% mark in the last five years.
However, the data does not fully capture certain aspects of the global supply chain. It does not account for cargo that might be illegally transshipped from China through other countries, nor does it reflect the extent to which Chinese-owned factories in other countries contribute to production lines. Additionally, the data overlooks the significant manufacturing shift from China to Mexico, where goods are manufactured and then shipped northward to U.S. consumers and businesses.
The alterations in sourcing patterns coincide with a moderation in annual containerized import volumes, reflecting the post-pandemic decline in U.S. demand. This decline helps elucidate the rationale behind the modest expectations for future inbound container growth in 2024. Total U.S. imports experienced a notable 12.9% decrease last year, amounting to approximately 24.2 million TEUs. In the two years preceding this decline, U.S. import volumes had reached record levels, just shy of 28 million TEUs. Examining the five years leading up to the pandemic-induced surge, U.S. import volumes exhibited a compound annual growth rate of merely 4.5%.


