




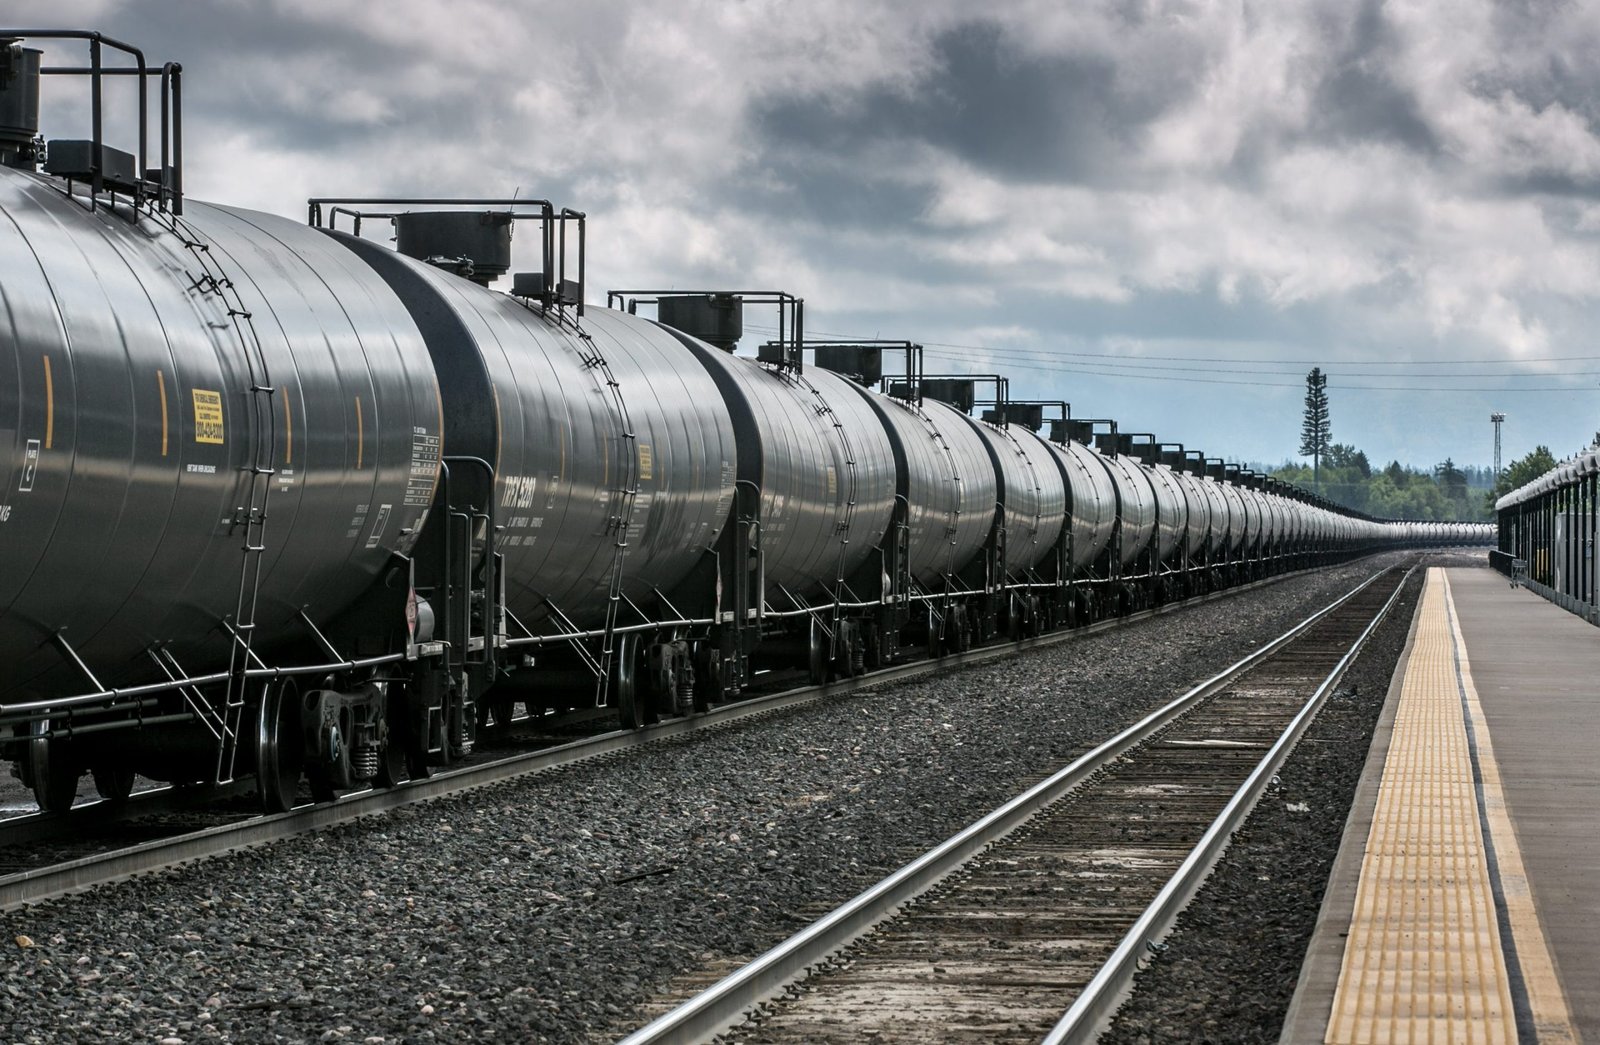
U.S. rail traffic continued to rise during the week ending August 29, with 543,212 carloads and intermodal units, up 4.1% compared with the same week last year, according to the Association of American Railroads (AAR).
Commodity freight totaled 240,021 carloads for the week, an increase of 2.2% from the same week a year ago. Intermodal traffic was the better performer, moving 303,191 containers and trailers, up 5.7% on an annual basis.
Seven of the 10 carload commodity groups tracked by the AAR reported increased shipments compared to the same period in 2025. Gains were led by metallic ores and metals, used widely in steelmaking, which are up 11 per cent. Next was petroleum and related products, up 8.4%. Grain shipments were up 8.3%.
Not all freight sectors were created equal. Chemical shipments declined 3.8 percent and motor vehicles and parts fell 6 percent.
Increased steel production related to data center construction may be helping to drive stronger shipments of metallic ores and metals, analysts have said. In the meantime, uneven manufacturing activity continued to produce fluctuating results for chemical freight.
Meanwhile, Intermodal continues to benefit from the large differential between trucking and rail transportation rates. SONAR data indicates the spread between truck and rail rates is approximately 34% today.
The recent deceleration in rising truck rates also seems to be coming to an end. The tender acceptance rate is climbing again as continued federal enforcement actions are reducing available trucking capacity.
Coal traffic also showed increases, up 1.9% over a year ago. The increase reflects the seasonal build-up ahead of winter, and growing use of coal by power generators amid stronger demand for energy and pro-coal backing from the Trump administration.
| This Week | Year-To-Date | ||||
|---|---|---|---|---|---|
| Cars | vs 2025 | Cumulative | Avg/wk | vs 2025 | |
| Total Carloads | 240,021 | 2.2% | 7,751,931 | 227,998 | 2.7% |
| Chemicals | 33,640 | -3.8% | 1,149,778 | 33,817 | 2.2% |
| Coal | 63,992 | 1.9% | 1,947,809 | 57,289 | -1.7% |
| Farm Products excl. Grain, and Food | 16,853 | 1.2% | 593,745 | 17,463 | 4.0% |
| Forest Products | 8,717 | 5.8% | 283,207 | 8,330 | 0.8% |
| Grain | 21,359 | 8.3% | 802,997 | 23,618 | 12.2% |
| Metallic Ores and Metals | 24,801 | 11.0% | 724,353 | 21,305 | 7.6% |
| Motor Vehicles and Parts | 16,443 | -6.0% | 526,377 | 15,482 | -0.7% |
| Nonmetallic Minerals | 33,812 | 3.7% | 1,038,231 | 30,536 | 2.4% |
| Petroleum and Petroleum Products | 11,450 | 8.4% | 375,399 | 11,041 | 7.4% |
| Other | 8,954 | -6.3% | 310,035 | 9,119 | 0.3% |
| Total Intermodal Units | 303,191 | 5.7% | 9,605,177 | 282,505 | 3.9% |
| Total Traffic | 543,212 | 4.1% | 17,357,108 | 510,503 | 3.3% |
1 Excludes U.S. operations of CPKC, CN and GMXT.
2 Average per week figures may not sum to totals as a result of independent rounding.
U.S. railroads reported cumulative volumes of 7,751,931 carloads during the first 34 weeks of 2026, up 2.7% compared with the like point in 2025. Intermodal was 9,605,177 units, up 3.9%.
Combined rail traffic for the period totaled 17,357,108 carloads and intermodal units, up a solid 3.3% from last year.
Traffic also improved during the week on nine U.S., Canadian and Mexican railroads in North America. Carloads were up 1.7 percent at 346,191Intermodal units were up 6 percent to 395,417
North American combined carloads and intermodal units totaled 741,608, an increase of 3.9% when compared to the same week in 2022.
North American rail volume for the first 34 weeks of 2026 totaled 23,812,940 carloads and intermodal units, up 3% from the same point in 2025.