



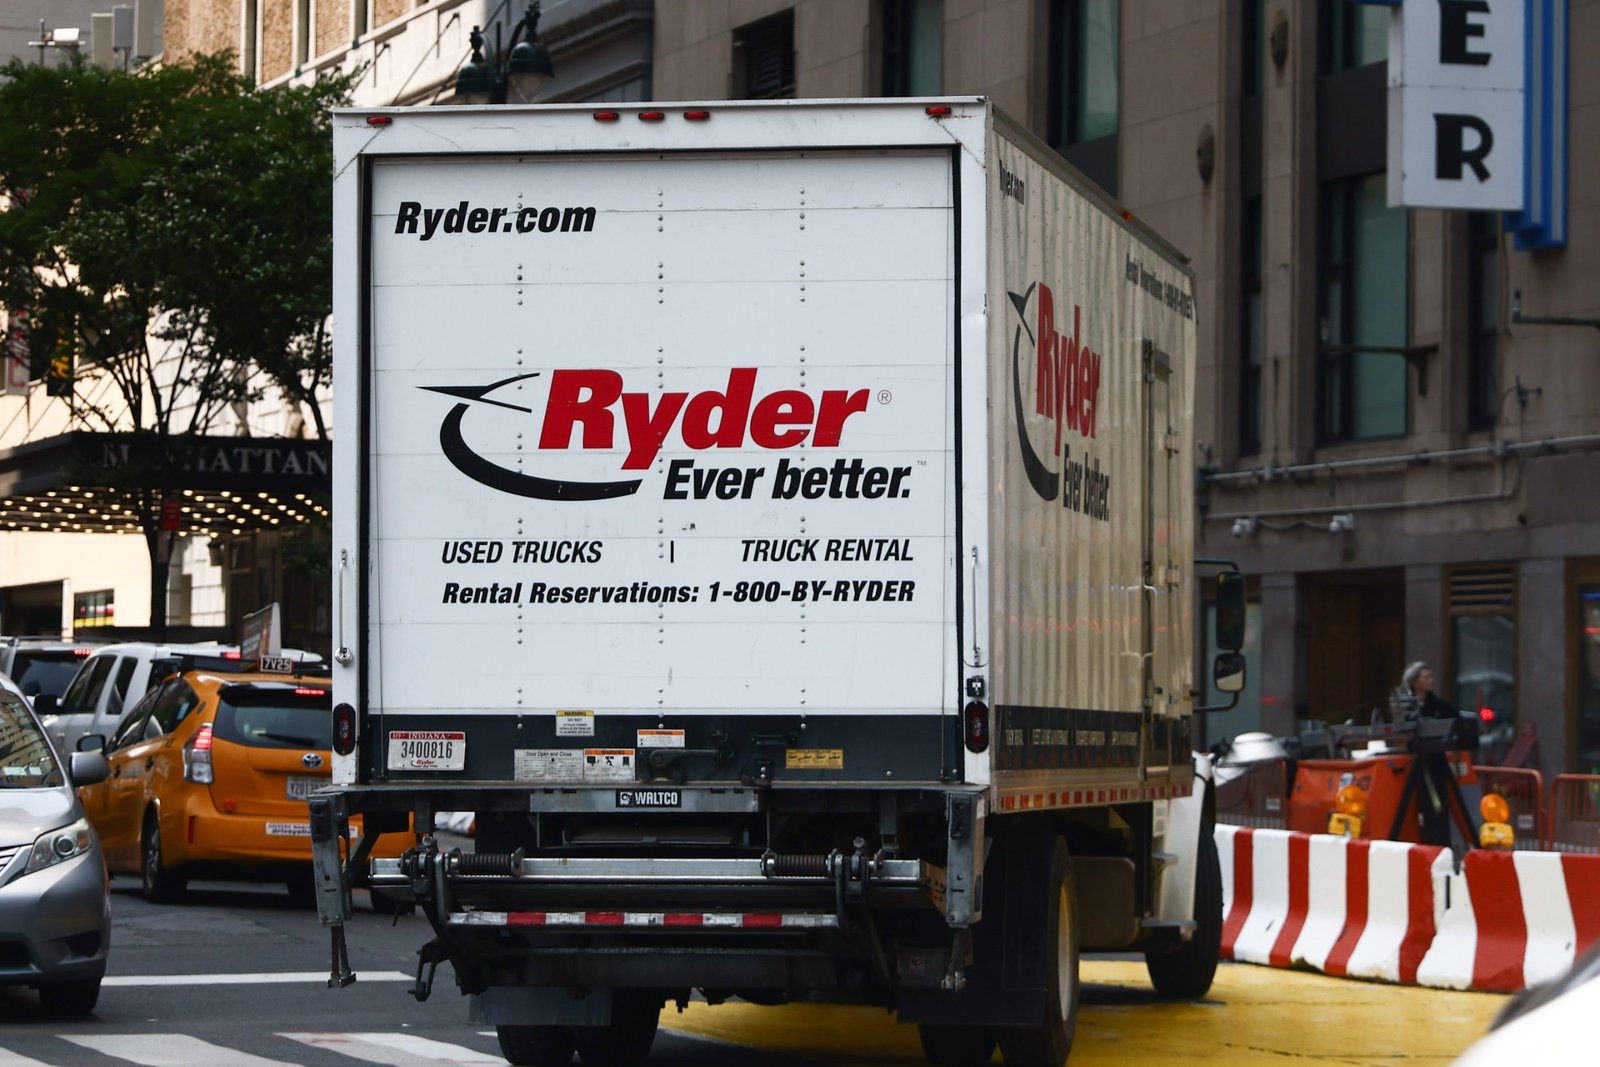
Ryder delivered a strong third quarter in 2026, recording improvements across most of its key performance indicators compared with the same period in 2025. The results prompted the transportation and logistics company to revise its full-year financial outlook upward, supported by revenue growth across its business segments and favourable conditions in the used-vehicle market.
The company, listed on the New York Stock Exchange under the ticker R, increased its full-year non-GAAP earnings-per-share forecast to a range of $14.85 to $15.05, compared with the previous estimate of $14.40 to $14.80 published following its second-quarter results. Ryder also raised its projected non-GAAP return on equity to between 18% and 19%, up from the earlier forecast of 18%.
Revenue growth across Ryder’s business segments
All three of Ryder’s principal business divisions recorded higher revenue during the quarter. Fleet Management Solutions (FMS), which encompasses the company’s vehicle rental and leasing operations, reported a 10% increase. Supply Chain Solutions (SCS), its contract logistics business, grew revenue by 9%, while Dedicated Transportation Solutions (DTS), which provides dedicated transportation services to shippers, posted a 6% rise.
Profitability also improved in two of the three divisions. Earnings before tax increased by 21% at FMS and 7% at SCS. DTS, however, recorded a 5% decline in earnings before tax.
Ryder attributed the weaker DTS performance to lower operating revenue and the absence of a workers’ compensation insurance benefit recorded in the previous year. These factors were partially offset by savings generated through strategic initiatives.
Used-vehicle prices provide an additional boost
The used-vehicle market remained an important contributor to Ryder’s quarterly performance. Although the company has been working to reduce its earnings dependence on used-vehicle sales, both sales volumes and market prices provided support during the period.
Ryder sold 5,100 used vehicles in the third quarter, compared with 4,900 a year earlier. Price increases were particularly significant: used tractor prices rose 19% year over year, while used truck prices increased 5%.
The market also strengthened compared with the second quarter of 2026. Used truck prices climbed 6% sequentially, while used tractor prices advanced 15%.
The impact of used-vehicle sales is reflected in Ryder’s financial results through provisions associated with these transactions. For the third quarter, the company reported a net negative cost of $17 million, compared with a positive $3 million in the same quarter of 2025 and a net negative $7 million in the second quarter of 2026. In this accounting context, the larger negative figure represented a benefit to the company’s results.
| 3Q2026 | 3Q2025 | Percent change unless specified | |
|---|---|---|---|
| Used Vehicles Sales | |||
| End of period fleet count | 7,300 | 8,500 | -14.1% |
| Used vehicles sold | 5,100 | 4,900 | 4.1% |
| Pricing Change | |||
| Tractors | 19% | -6% | Increased by 2,500 bps |
| Trucks | 5% | -15% | Increased by 2,000 bps |
| ChoiceLease | |||
| Average fleet count | 140,000 | 142,400 | -1.7% |
| End of period fleet count | 139,800 | 142,300 | -1.8% |
| Average active fleet count | 131,100 | 133,200 | -1.6% |
| End of period active fleet count | 131,300 | 132,900 | -1.2% |
| Commercial Rental | |||
| Average fleet count | 29,400 | 33,300 | -11.7% |
| End of period fleet count | 29,800 | 32,700 | -8.9% |
| Rental utilization – power units | 77% | 70% | Increased by 700 bps |
| Rental rate change | 4% | 5% | Decreased by 100 bps |
| Segment total revenue (millions) | |||
| Fleet Management Solutions | 1,616 | 1,465 | 10.3% |
| Supply Chain Solutions | 1,504 | 1,380 | 9.0% |
| Dedicated Transportation Solutions | 606 | 570 | 6.3% |
| Revenue and income | |||
| Operating revenue (millions) | 1,344 | 1,282 | 4.8% |
| Non-GAAP EPS | $4.33 | $3.57 | 21.3% |
Source: Ryder, third-quarter 2026 financial results. Revenue figures are in millions where specified.
Citi points to rental utilization, used vehicle performance
In an early review issued shortly after Ryder posted its results, Citi analyst Ben Mohr said the quarterly numbers were “better than expected”. He showed the company’s rental utilization rate of 77% versus Ryder’s target of 80%.
The $17 million net benefit from used-vehicle sales was also better than expected, Mohr said. The expectation was $10 million.
DTS’s weaker year-over-year performance was a watch point. But Mohr pointed to more and more straitened conditions in the driver labor market as a factor that could influence the division’s operating costs and future demand.
“The ongoing driver market tightening will likely see DTS facing higher driver hiring costs/wages/bonuses, which should offset some of the outsourcing to DTS by shippers,” he said.
The review indicates greater recruitment costs, wages and bonuses may squeeze DTS margins, although tighter driver availability may push more shippers to outsource transportation activities to dedicated carriers.
Results are well received by investors
Ryder has scheduled its third-quarter earnings call for Thursday at 11 a.m. Investors listening in will probably hear more about the company’s performance and outlook.
Ryder’s stock had climbed 29.8% year to date, ahead of the earnings announcement. However the stock had fallen by around 12.5% over the last three months although it had made a small gain over the last month.
The quarterly results were met with an initial positive market reaction. Ryder shares climbed 5.92%, gaining $14.22 to $254.53 at about 9:40 a.m. Eastern Daylight Time.
Ryder began the final quarter of 2026 with a more upbeat outlook on its finances, fueled by revenue growth in its core businesses, higher prices for used vehicles and a better full-year forecast. How long it can keep up that momentum will depend on continued operational progress, market conditions and its ability to manage costs in the dedicated transportation business.