




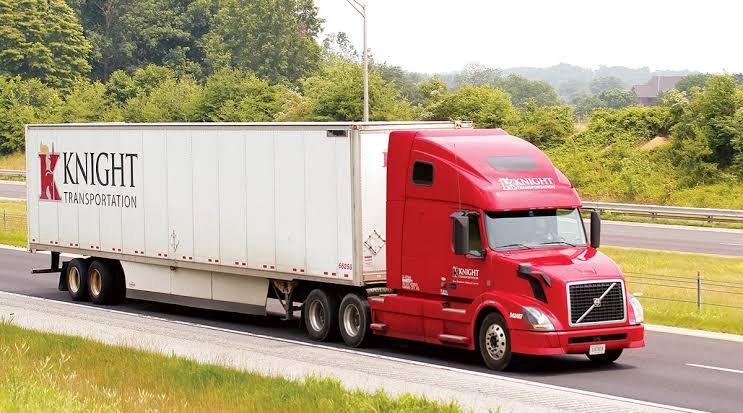
Knight-Swift Transportation delivered better-than-expected third-quarter results on Wednesday after the market closed, supported by stronger truckload pricing, improved operating efficiency and higher revenue. The US transportation group reported adjusted earnings per share of $0.83, exceeding analysts’ consensus estimate by $0.07 and surpassing its own guidance range of $0.71 to $0.77.
The result also represented an improvement of $0.51 per share compared with the same period last year, reflecting a more favorable operating environment and lower financing costs.
Revenue reached $2.2 billion, up 14% year over year. Excluding fuel surcharges, growth stood at 8%. The figure slightly exceeded analysts’ expectations of $2.17 billion.
Chief Executive Officer Adam Miller said the company expects momentum to continue building across its businesses as freight rates adjust, cost-control measures remain in place and seasonal spot-market and project opportunities increase. He noted that the company anticipates more of these opportunities than it has experienced in recent years.
Truckload operations benefit from stronger pricing
Knight-Swift’s truckload (TL) division remained a key contributor to the quarterly performance. Revenue excluding fuel surcharges increased 6.5% year over year, as an 11% rise in revenue per tractor partly offset a 4% decline in the average number of tractors in service.
Operational indicators also showed continued improvement. Loaded miles per tractor increased 1% compared with the previous year, marking the eighth consecutive quarterly year-over-year increase. Deadhead miles, meanwhile, declined by 170 basis points to 12.1%.
Revenue per loaded mile, excluding fuel, climbed 10% year over year. The company recorded an even stronger improvement in its over-the-road services, where the increase reached a mid-teens percentage.
The truckload division posted an adjusted operating ratio of 89.2%, an improvement of 700 basis points from the same quarter last year. The result was consistent with the midpoint of management’s guidance range.
Performance differed between the group’s established operations and its acquired business. U.S. Xpress, acquired in 2023, recorded an adjusted operating ratio in the low-90% range. Knight-Swift’s legacy brands performed better, with an adjusted ratio of 88%.
| Knight-Swift Transportation | Q3/26 | Q3/25 | Y/Y Gross Change | Y/Y % Change |
|---|---|---|---|---|
| TL: | ||||
| Revenue (ex fuel) | $1,154.9 | $1,084.4 | $70.5 | 6.5% |
| Average Tractors | 20,470 | 21,319 | -849 | -4.0% |
| Miles/Tractor | 21,143 | 21,337 | -194 | -0.9% |
| Deadhead % | 12.1% | 13.8% | -170 bps | -12.3% |
| Loaded Miles/Tractor | 18,585 | 18,392 | 192 | 1.0% |
| Loaded Miles | 380,428,748 | 392,109,580 | -11,680,832 | -3.0% |
| Revenue per Loaded Mile (ex fuel) | $3.04 | $2.77 | $0.27 | 9.8% |
| Revenue/Tractor (ex fuel) | $56,419 | $50,864 | $5,555 | 10.9% |
| Average Length of Haul | 378 | 368 | 10 | 2.7% |
| Adjusted OR % | 89.2% | 96.2% | -700 bps | -7.3% |
Revenue in millions
| Knight-Swift Transportation | Q3/26 | Q3/25 | Y/Y Gross Change | Y/Y % Change |
|---|---|---|---|---|
| Logistics: | ||||
| Revenue | $139.0 | $140.4 | -$1.4 | -1.0% |
| Loads (estimated) | 48,171 | 71,380 | -23,209 | -32.5% |
| Brokerage Revenue per Load | $2,885 | $1,967 | $918 | 46.7% |
| Brokerage Gross Margin % | 18.9% | 17.8% | 110 bps | 6.2% |
| Adjusted OR % | 93.1% | 94.3% | -120 bps | -1.3% |
Revenue in millions
| Knight-Swift Transportation | Q3/26 | Q3/25 | Y/Y Gross Change | Y/Y % Change |
|---|---|---|---|---|
| Intermodal: | ||||
| Revenue | $122.9 | $94.1 | $28.8 | 30.6% |
| Load Count | 40,090 | 35,375 | 4,715 | 13.3% |
| Average Revenue per Load | $3,065 | $2,660 | $405 | 15.2% |
| Average Containers | 12,480 | 12,535 | -55 | -0.4% |
| Average Loads per Container | 3.2 | 2.8 | 0.4 | 13.8% |
| Adjusted OR % | 97.8% | 99.8% | -200 bps | -2.0% |
Revenue in millions
| Knight-Swift Transportation | Q3/26 | Q3/25 | Y/Y Gross Change | Y/Y % Change |
|---|---|---|---|---|
| LTL: | ||||
| Revenue (ex fuel) | $341.7 | $340.5 | $1.2 | 0.4% |
| Shipments/Day | 24,681 | 25,028 | -347 | -1.4% |
| Weight/Shipment (pounds) | 1,053 | 1,005 | 48 | 4.8% |
| Tonnage/Day | 12,995 | 12,577 | 418 | 3.3% |
| Revenue/Shipment (ex fuel) | $192.70 | $185.27 | $7.43 | 4.0% |
| Revenue/cwt (ex fuel) | $18.30 | $18.43 | -$0.13 | -0.7% |
| Average Length of Haul | 715 | 673 | 42 | 6.2% |
| Adjusted OR % | 91.4% | 90.6% | 80 bps | 0.9% |
Revenue in millions
| Knight-Swift Transportation | Q3/26 | Q3/25 | Y/Y Gross Change | Y/Y % Change |
|---|---|---|---|---|
| Consolidated: | ||||
| Revenue | $2,200.9 | $1,927.1 | $273.9 | 14.2% |
| Revenue (ex fuel) | $1,852.8 | $1,720.9 | $131.9 | 7.7% |
| Adjusted OR % | 89.3% | 93.8% | -450 bps | -4.8% |
| Adjusted EPS | $0.83 | $0.32 | $0.51 | 159.4% |
Revenue in millions
Knight-Swift’s key performance indicators provide an overview of the company’s operating performance across its transportation activities.
LTL revenue rises, operating efficiency slips
The less-than-truckload (LTL) unit was not as impressive. Year-over-year revenue was up less than 1% excluding fuel surcharges, while tonnage was up 3%.
Excluding fuel, revenue per hundredweight dropped 1%. The yield movement was largely due to changes in the characteristics of the shipments. Average weight per shipment rose 5 percent and average length of haul rose 6 percent. These two factors largely offset each other in terms of their impact on revenue yield.
Revenue per shipment, excluding fuel surcharges, increased 4%. Contractual rate renewals also continued to be positive with mid-single digit percentage range increases.
The LTL division’s adjusted operating ratio, however, deteriorated to 91.4%, up 80 basis points year-over-year due to less efficient operating performance compared to the year-ago period.
Fourth quarter earnings outlook as per market consensus
Knight-Swift expects adjusted earnings per share for the fourth quarter to be in the range of $0.78 to $0.84. That range included the consensus estimate of $0.82 at the time the results were announced, indicating management’s view was largely in line with market expectations.
A number of financial drivers contributed to higher third quarter adjusted earnings versus a year ago. Net interest expense decreased $22 million, or approximately $0.10 per share. The lower tax rate added another $0.05 a share and a modest increase in equipment sales gains added $0.01 a share.
Offsetting the positive contributions somewhat was a decrease of $3.5 million in other income, or about $0.02 per share.
Investors liked the results. Knight-Swift’s stock, which trades on the New York Stock Exchange under the ticker KNX, was up 4.4% in after-hours trading Wednesday.
The company scheduled a conference call for 5:30 p.m. will report its third-quarter results Wednesday. EDT. Eastern Daylight Time.
The importance of Knight-Swift results to the freight market
Knight-Swift is the largest asset-based truckload carrier in the US and investors and industry participants watch it as a sign of the overall health of the freight market.
Recent results include improved pricing, continued improvements in truckload productivity and continued efforts to control costs. The outlook also incorporates improved seasonal demand opportunities and potential for additional rate adjustments.
All these trends suggest that the US truckload market may be on a stronger recovery track after a long cyclical downswing. Data for the truckload and LTL segments, however, has been mixed, indicating the recovery is still uneven across the freight industry.