



Worldwide air cargo tonnages increased by 5% year on year (YoY) in August, according to the latest figures from WorldACD Market Data. The overall growth comes despite a pronounced decline in shipments from Hong Kong to Europe, where volumes fell 30% YoY and stood 24% below their June level, before the European Union introduced new import duty rules on 1 July.
China-Europe traffic also remained under pressure. In week 35, covering 24 to 30 August, tonnages from China to Europe were down 6% YoY. Across August as a whole, the decline stood at 5% YoY, an improvement compared with the 8% drop recorded in July.
When mainland China and Hong Kong are combined, tonnages to Europe fell 14% YoY in both July and August. That compares with stable year-on-year volumes in June.
The latest data from WorldACD point to a significant adjustment in the way e-commerce players are using air logistics for relatively low-value cross-border shipments. The decline in Hong Kong-Europe traffic illustrates the extent of the recalibration following the end of the EU’s ‘de minimis’ exemption for imported goods valued below €150.
Although estimated Hong Kong-Europe air cargo tonnages in August were approximately 7% lower than in July, weekly figures provide some indication that the decline may have reached its bottom. During week 35, volumes recovered 3% compared with the previous week and were 6% above the level recorded in week 33, which currently appears to have been the lowest point.
Mainland China-Europe tonnages have also shown signs of recovery. Unlike Hong Kong traffic, these volumes are less heavily dependent on e-commerce shipments. They have increased week on week for four consecutive weeks, following a cumulative decline of around 15% after the changes introduced on 1 July.
China and Hong Kong-Europe trade contrasts with US traffic
The picture is notably different on the China/Hong Kong-US trade lane.
Combined China/Hong Kong (CN/HK) to US volumes in August were broadly in line with their levels in May, June and July. They were also 13% higher YoY than in August last year.
Within that total, China-US traffic increased 15% YoY, while Hong Kong-US volumes rose 9% YoY.
However, the pace of annual growth has begun to moderate. CN/HK-US tonnage growth stood at 13% in August and 14% in July, compared with 19% in May and 20% in June.
Pricing trends have also shifted significantly since July.
For CN/HK-Europe, average spot rates fell from approximately US$5.22 per kilo in May and June to US$4.34 per kilo in August, representing a decline of around 17%.
The premium over the previous year has narrowed as well. On a YoY basis, the difference fell from 32% in May and 30% in June to just 12% in July and 11% in August.
The CN/HK-US market has experienced a similar, although less pronounced, adjustment. Average spot rates declined from US$6.59 per kilo in June to US$5.89 per kilo in August, a drop of approximately 11%.
Compared with the same period last year, the premium on this trade lane narrowed from 50% in May and June to 26% in August.
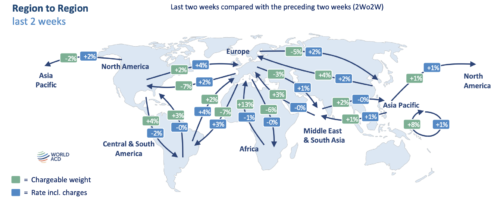
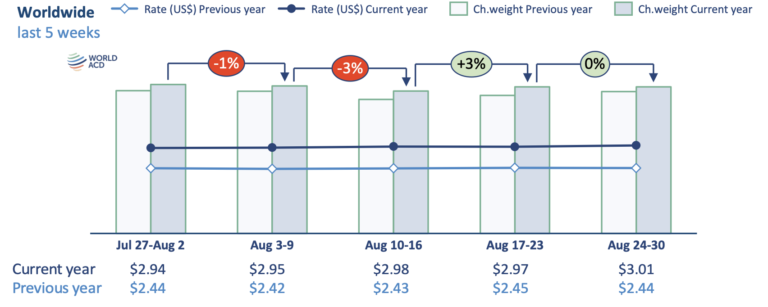
Looking beyond individual trade lanes, the global air cargo market continued to expand in August. Worldwide tonnages were approximately 5% higher YoY, with each of the main origin regions recording growth between 4% and 5%, according to more than 2 million monthly transactions captured in WorldACD’s database.
The August performance broadly matched the 5% YoY growth recorded in July. The same general trend is visible across the first eight months of 2026, although regional year-to-date growth remains uneven. Asia Pacific origins recorded the strongest increase, at 8%, while tonnages ex-Africa remained stable YoY.
Price levels, meanwhile, remained substantially above those of last year, although the premium has continued to narrow.
Average worldwide air cargo rates, combining spot and contract pricing, were 22% higher YoY in August. This compares with a 24% increase in July, 33% in June and 37% in May.
Average worldwide spot rates reached US$3.36 per kilo in August, up 28% YoY. Nevertheless, rates slipped slightly, by 1%, compared with July and were around 9% below their average level across April, May and June of this year.
The sharpest percentage movement was recorded from Middle East & South Asia (MESA) origins. Average rates fell by approximately 17%, from US$4.75 per kilo in April to US$3.92 per kilo in August.
From Asia-Pacific origins, average spot rates declined from US$5.03 per kilo in April to US$4.52 per kilo in August, representing a decrease of around 10%.
| Origin Regions last 2 to 5 weeks | Capacity1 | Chargeable weight1 | Rate1 | ||||||
|---|---|---|---|---|---|---|---|---|---|
|
WORLD
ACD |
Last 5 wks | 2Wo2W | YoY | Last 5 wks | 2Wo2W | YoY | Last 5 wks | 2Wo2W | YoY |
| Africa | -1% | +5% | +6% | +6% | -3% | +17% | |||
| Asia Pacific | +2% | +3% | +4% | +4% | -0% | +20% | |||
| C. & S. America | -0% | +6% | +3% | +5% | +2% | +10% | |||
| Europe | +0% | +1% | -5% | +6% | +2% | +23% | |||
| M. East & S. Asia | +1% | +2% | +0% | +5% | -0% | +47% | |||
| North America | +0% | +4% | -0% | +6% | -0% | +21% | |||
| Worldwide | +1% | +2% | +1% | +5% | +1% | +22% | |||
Capacity edges higher
Air cargo capacity also showed a modest increase during the final weeks of August.
Total worldwide capacity rose by 1% over the final two weeks compared with the preceding two weeks (2Wo2W). Asia Pacific origins recorded the largest increase, with capacity rising 2%.
Compared with the same period last year, worldwide air cargo capacity was 2% higher YoY.
The increase comes despite disruptions during the year linked to the conflict between the US and Iran. Capacity from MESA origins during the final two weeks of August was nevertheless 2% higher YoY, while capacity remained stable in week 35 on both a week-on-week and year-on-year basis.
Capacity from the region, however, remains below its pre-conflict level. Compared with week 7, before the US and Israel attack on Iran, MESA-origin capacity in week 35 was still almost 9% lower.
The impact has been particularly pronounced in the Gulf area, where capacity was down 16% compared with week 7.
Other surrounding subregions have performed better. Capacity from South Asia was 1% higher, while Central Asia increased 2% and the Levant & Caucasus rose 8% over the same comparison period.