




Latest truckload data indicates a more supply driven market than demand driven. Offered volumes that are still accepted are still near multi-year lows but rejection rates are still high which means there is still room for the current trucking cycle to tighten.
The Accepted SONAR Truckload Volume Index (ASTVI), which tracks the volume of truckload tenders accepted by carriers to haul freight under existing rate contracts, averaged about 9,800 last week.
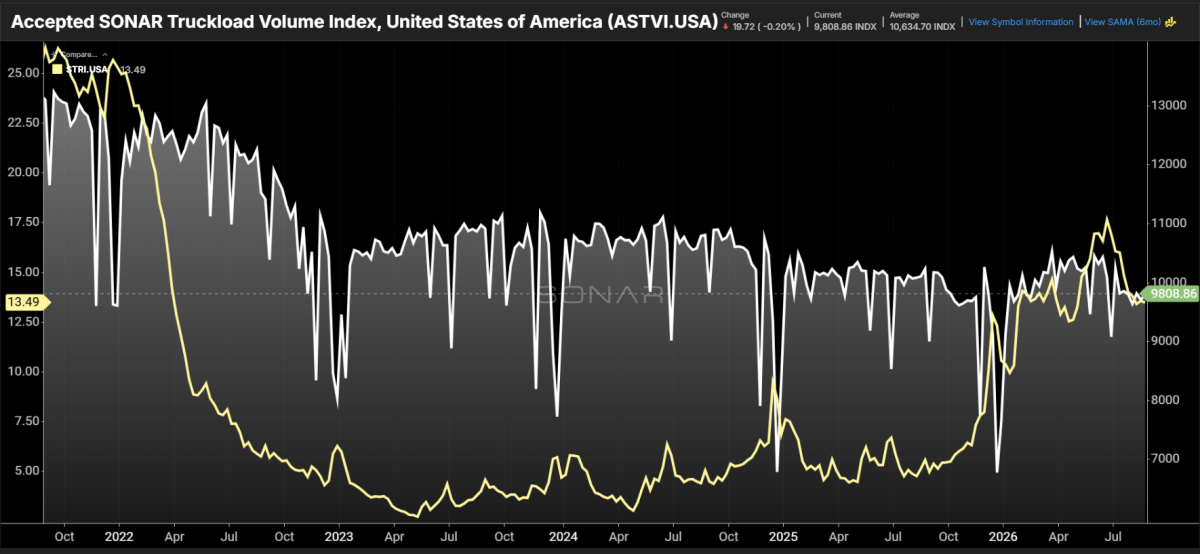
Meanwhile, the SONAR Truckload Rejection Index (STRI), which tracks the percentage of loads tendered that carriers reject, remained at roughly 13.5%.
Both indices have pulled back from 12 month highs. But together they paint the picture of a truckload marketplace that has not been more supply-driven in recent history.
Accepted tender volumes are a good proxy for total truckload demand, especially for contract freight where rejection rates are low. But when rejection rates increase, there’s a better gage of how much freight a carrier can truly handle with its existing capacity — the amount of freight accepted.
The main signals are volume acceptance and tender rejections.
The ASTVI and STRI relationship is one key thing to watch for changes in the trucking market.
The usual interpretation of this combination is growth in capacity or growing efficiency of the market as accepted volumes increase and rejection rates fall.
But a relatively flat accepted tender and rising rejections can be signs of tightening capacity. That was October 2025 and October 2024.
A simultaneous fall in the rates of accepted volumes and rejection rates is more likely to be explained by weaker demand. That was the story in July.
Demand for freight has slipped recently, which has lowered rejection levels, but that is not to be confused with more capacity in trucking.
One of the reasons that shippers are using intermodal transportation more and more as opposed to trucks is the cost advantage of intermodal transportation.
Changes on the demand side are more volatile and can affect the market relatively fast. The supply side takes much longer to adjust. It’s been a three-plus year journey to work through the massive excess in the trucking market created by the COVID-driven freight boom during the slow recovery.
And today’s ASTVI levels are confirming that. The volumes received are now back to 2019 levels and below the levels for most of the last four years except for October and November last year.
The difference: The rejection rate was below 5 percent for most of 2019 and below 6 percent last fall. Demand is roughly the same, but the market is more than twice as tight.
The supply is slowly correcting itself
That would imply the upside for freight demand is larger than the downside, but there remains a chance of further deterioration.
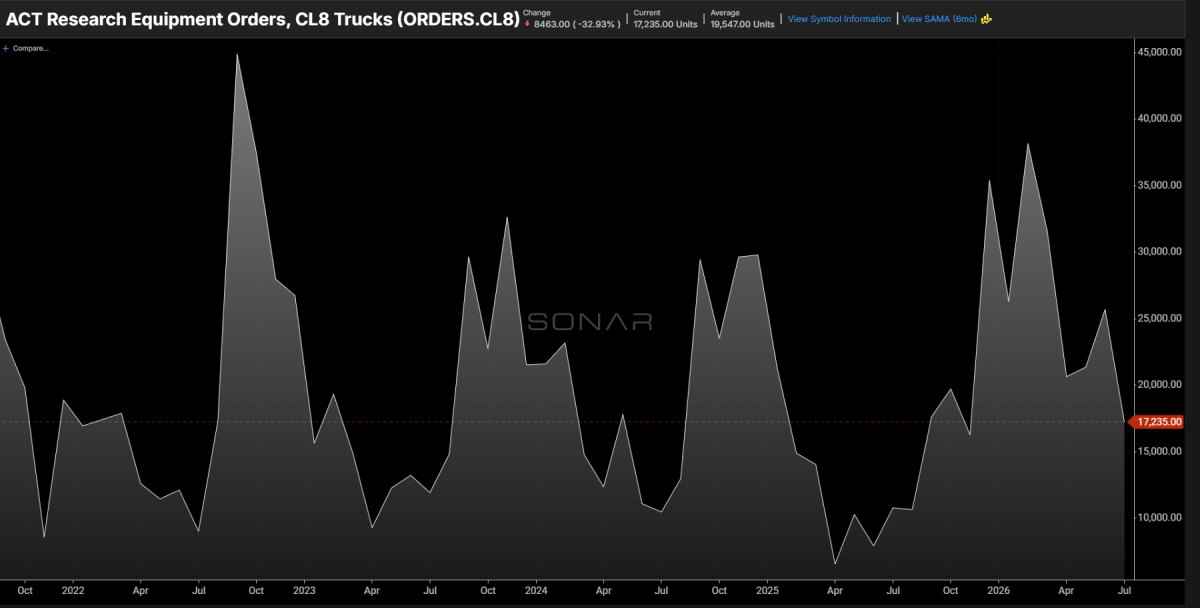
The Q2 2026 earnings releases do not show much sign of meaningful fleet expansion. The majority of carriers posted lower active truck counts year-over-year. Class 8 truck orders are higher this year but off of very low 2025 levels. The bulk of the order increase was to replace aging vehicles in fleets rather than grow fleet size, said ACT Research and FTR.
But maybe it’s too early in the data to see a big shift in capacity. Carriers are coming out of one of the longest, most painful freight slumps since the Great Recession of 2009.
Conditions for credit remain tight. Broke. Owes money. Not a cent. “The overall goods economy is still very strong and the current trucking cycle has a lot more runway left.
“The risks are now a little more skewed to further tightening than a quick move back to easier conditions.” This is due to a number of reasons including higher demand, disruptions in rail networks, increased intermodal rates and government pressure on trucking capacity.