



CHICAGO – The pressure on last-mile economics is showing little sign of easing. New research from FarEye indicates that median last-mile delivery costs increased by 12% in 2026, marking a second consecutive year of double-digit growth.
The findings, released Thursday, show that the increase was not limited to a small group of operators. Six in 10 respondents reported cost increases of more than 10%, while one in five said their last-mile expenses had risen by more than 20%.
The survey also highlights a widening challenge for companies attempting to grow their delivery networks efficiently. Eighty-eight percent of operators said delivery costs are increasing at the same rate as revenue or faster. Only one in eight said they are currently generating operating leverage as they scale.
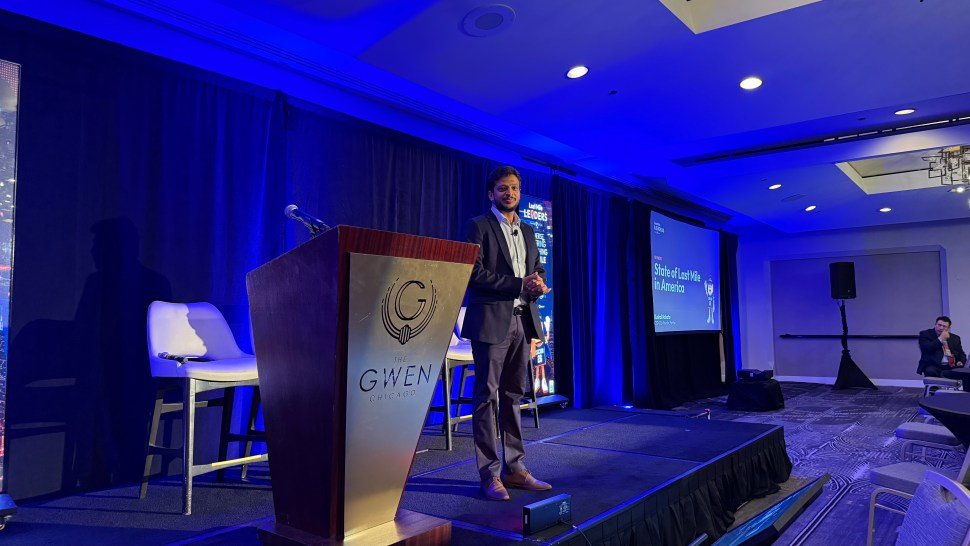
FarEye CEO and co-founder Kushal Nahata presented the findings Thursday during the Last Mile Leaders America event in Chicago.
Initially, operators may have expected the previous year’s double-digit increase to be an exception. The latest figures suggest otherwise.
“We thought probably it’s an anomaly, it’s not in double digits, but we saw that again this year as well,” Nahata said. “So now it’s probably the new normal that our delivery costs overall are increasing by almost double digits year on year.”
The research collected more than 3,000 data points from U.S. delivery operators during the first half of 2026. Control-related figures are based on the 41 operators that responded to the control question, while fleet-mix figures come from 84 operators.
Last-mile expenses remain firmly in double-digit territory
Fuel remains the most frequently cited cost pressure. Seventy percent of operators placed it among their top three cost concerns. Driver costs and driver availability followed at 51%, while vehicle operating costs were cited by 40%.
Inefficient routing ranked among the top three pressures for 21% of operators. Failed deliveries and returns made the list for 18%.
Nahata attributed the 12% increase partly to higher carrier rates and partly to operational inefficiencies.
“This twelve percent is obviously a combination of about six percent, which is the public rates that were increased by FedEx, UPS,” Nahata said. “But along with that, this additional six percent which gets contributed by the operational inefficiencies that we have in our operations.”
The six-percentage-point split is Nahata’s on-stage calculation rather than a breakdown produced by the survey itself. Nevertheless, the broader finding remains clear: persistent increases in delivery expenses are putting additional pressure on delivery businesses.
“Neither the CFOs nor the business allow us to operate at any cost,” Nahata said. “The cost needs to come down as well.”
Reducing delivery expenses has consequently become a major investment priority. Forty-five percent of operators ranked cost reduction among their top three investment priorities, making it the most commonly selected priority in the survey.
The largest companies faced the steepest increase. Operators with more than $1 billion in revenue recorded a median cost increase of 13.8%, the highest among all revenue categories.
Reliability is becoming central to the delivery promise
The research suggests that consumers are increasingly valuing certainty alongside speed.
Predictable delivery times and successful first-attempt deliveries together represented 55.7% of the delivery promise attributes operators said mattered most. By comparison, delivering as quickly as possible accounted for 11.4%.
“What consumers are looking for, as we see it now, is speed along with certainty or reliability,” Nahata said. “The delivery promise is probably the biggest thing. That’s where consumers have moved.”
The operational results varied significantly depending on what operators prioritized.
The eight operators that placed maximum speed first achieved 76% on-time performance while recording a 24% increase in costs.
Those prioritizing predictable delivery achieved 88.4% on-time performance and a 10% increase in costs. Operators that made visibility their first priority recorded 90.3% on-time performance and only a 4.9% increase in costs.
Customer inquiries about shipment status commonly referred to as WISMO, or “where is my order?” followed a similar pattern.
Operators with WISMO rates above 30% recorded 17.2% cost inflation and 81.4% on-time performance. At the other end, operators with WISMO rates of 5% or less reported 7.3% inflation and 86.5% on-time performance.
That means the high-WISMO group experienced 2.4 times the cost inflation of operators with the lowest WISMO rates.
“WISMO probably is a good economic indicator of your last-mile cost as well,” Nahata said. “It’s not just about customer experience.”
Proactive notifications about delivery delays were the only customer-experience capability identified in the survey as being associated with stronger on-time performance. Operators using such notifications achieved 88.1% on-time performance, compared with 81% among those that did not.
“If we’re trying to make a delivery promise, it’ll impact the cost side as well,” Nahata said. “We can’t solve one for the other.”
Greater operational control tracks with stronger performance
The survey also found a clear relationship between operational control and several key performance indicators.
Among the 41 operators that answered the control question, on-time performance ranged from 65.5% among the low-control group to 93% among the middle-control group and 95% among the high-control group.
WISMO rates followed the opposite direction, standing at 20.8%, 10.4% and 6.2%, respectively.
Median cost inflation also declined as control increased, from 14.5% in the low-control group to 10.5% in the middle group and 8.3% among operators with the highest level of control.
Median investment levels were identical across the three groups.
Higher technology maturity was associated with a lower cost-per-delivery band, although it had almost no relationship with year-over-year inflation or on-time performance.
Hybrid fleets dominate the delivery landscape
The modern delivery network is increasingly built around a combination of owned and outsourced capacity.
Fifty-seven percent of operators surveyed said they run a hybrid fleet. Another 26% are fully outsourced, while 17% operate exclusively with an owned fleet.
Among hybrid operators, 47% said they intend to outsource more of their operations.
Hybrid networks recorded 93% on-time performance and a 7% WISMO rate.
The increasing complexity of these mixed networks is also putting greater emphasis on visibility. Customers have become more accustomed to real-time tracking updates and increasingly expect shipment visibility to be part of the purchasing experience.
“Can your team answer these questions without picking up a phone?” Nahata said. “Where is the shipment?”
AI adoption is accelerating, but execution remains behind
AI adoption among delivery operators is advancing rapidly, although the research suggests that implementation is still outpacing operational execution.
The proportion of operators at either the implementation or operational stage of AI increased from 46.2% in 2025 to 66.3% in 2026.
At the same time, extensive operational adoption rose from 4% to 13.8%.
“Last year when we looked at AI implementation, about forty-six percent of businesses said they are doing it,” Nahata said. “Now we hear it’s sixty-six percent.”
“There were four percent last year who said full scale. Now almost 14 percent are saying it’s a full-scale one.”
The most common AI applications were ETA prediction, cited by 39% of operators; demand forecasting, at 36%; and customer support, at 31%.
Real-time dynamic routing was the least common application among those listed, at 21%. It was also the only operational-decision use case in the group.
Trust in AI for real-time operational decisions remained relatively low, with mean trust reaching just 1.98 on a four-point scale.
“Where we see the biggest change is moving from prediction to execution,” Nahata said. “It’s not just about answering, it’s about getting things done as well.”
The relationship between technology deployment and operational outcomes was not necessarily straightforward.
Operators with the smallest roadmap backlog achieved 93% on-time performance and a WISMO rate of 5.2%.
By contrast, operators with the largest number of capabilities still sitting on their roadmap recorded 85.5% on-time performance and 17.4% WISMO.
Companies operating three or more named systems recorded 80.9% on-time performance, compared with 85.6% among those using a single system.
For Nahata, the data points to a broader lesson about last-mile operations: success will depend less on the number of promises a company makes than on its ability to deliver consistently and profitably.
“The winners will not be the companies that promise the most,” Nahata said. “They will be the companies that can keep the promises that matter, at an economics the business can scale.”