




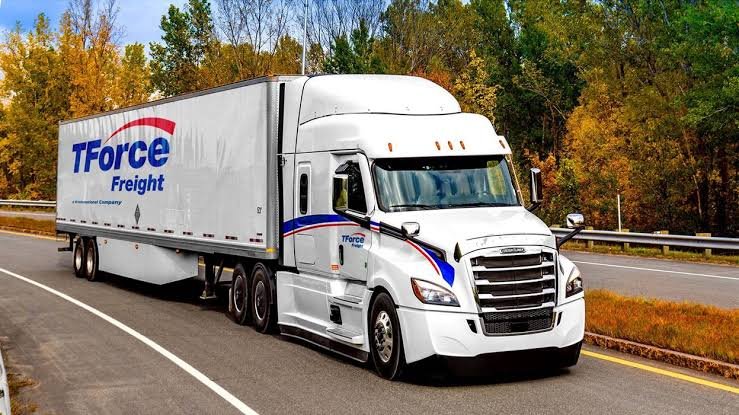
Truckload emerges as TFI International’s strongest performer in the third quarter
TFI International’s Truckload division is gaining visibility within the company’s broader transportation portfolio, delivering particularly strong third-quarter results that contrast with the weaker profitability recorded in its less-than-truckload (LTL) business.
The Canadian transportation group has traditionally been associated with its LTL operations, one of its best-known business segments. However, its latest financial performance suggests that Truckload is becoming an increasingly important contributor to the company’s earnings.
In its third-quarter results, released Thursday afternoon, TFI International (NYSE: TFII) reported an improvement in the Truckload segment’s operating ratio, while the LTL division experienced a deterioration compared with the same period last year.
Chief Executive Alain Bedard placed particular emphasis on the Truckload business in his accompanying statement, describing its quarterly performance as “remarkably strong.”
“Our Truckload performance is particularly gratifying, with double digit top line growth despite fewer trucks and operating income that nearly doubled,” Bedard said.
The contrasting performances across the company’s divisions helped bring TFI International’s consolidated operating ratio (OR) down to 89.5%, compared with 91.2% in the third quarter of the previous year.
Truckload overtakes LTL in operating income
The financial figures underline the shift in the company’s earnings contribution. Truckload generated $100.2 million in operating income, representing a 13.3% increase year over year. By comparison, the LTL division recorded $44.4 million, up 6.6%.
The change is particularly significant when measured against the previous year’s results. During the corresponding period, LTL produced $77.7 million in operating income, comfortably ahead of Truckload’s $52.6 million.
The Logistics division also delivered a stronger contribution than LTL, generating $49.4 million in operating income during the quarter.
| Financial indicators | 3Q2026 | 3Q2025 | Percentage change except where noted |
|---|---|---|---|
| Total LTL, US and Canada | |||
| Revenue before fuel surcharge | $667,664 | $687,044 | -2.82% |
| Adjusted EBITDA | $108,229 | $126,660 | -14.55% |
| Revenue per ’00 wt ex fuel | $19.85 | $20.03 | -0.90% |
| Revenue per shipment ex fuel | $239.87 | $307.51 | -22.00% |
| Revenue per hundredweight w/ fuel | $26.01 | $24.23 | 7.35% |
| Tonnage (in thousands of tons) | 1,373 | 1,361 | 0.88% |
| Shipments (in thousands) | 1,855 | 1,773 | 4.62% |
| Average weight per shipment (lbs) | 1,480 | 1,535 | -3.58% |
| Average length of haul (miles) | 1,049 | 1,044 | 0.48% |
| Adjusted OR % | 91.3% | 88.8% | Deteriorated by 250 bps |
| Operating income (‘000) | $44,399 | $77,728 | -42.88% |
| Total Truckload | |||
| Revenue before fuel surcharge (‘000) | $753,036 | $311,001 | 142.13% |
| Adjusted EBITDA | $174,735 | $140,101 | 24.72% |
| Operating income (‘000) | $100,233 | $52,606 | 90.54% |
| Adjusted Operating Ratio | 86.7% | 92.3% | Improved by 560 bps |
| Revenue per truck per week ex fuel | $4,880 | $4,311 | 13.20% |
| Truck count avg | 6,604 | 7,501 | -11.96% |
| Trailer count avg | 20,669 | 22,122 | -6.57% |
| Average number of owner operators | 2,441 | 2,563 | -4.76% |
| Total Logistics | |||
| Revenue before fuel surcharge | $436,431 | $367,774 | 18.67% |
| Adjusted EBITDA | $70,118 | $46,314 | 51.40% |
| Operating income | $49,431 | $31,027 | 59.32% |
These results highlight the growing importance of TFI’s Truckload and Logistics activities, particularly as the company’s traditional LTL business faces pressure on several operating indicators.
Higher shipment volumes fail to boost LTL performance
The LTL division’s weaker operating ratio was accompanied by declines in several key performance indicators.
Revenue per hundredweight excluding fuel surcharges fell less than 1%. The measure, a key gage of price and yield performance, dipped just a shade.
But revenue per shipment, excluding fuel, plunged much more sharply, down 22% from the same quarter a year earlier.
The average weight of shipments was also lower, down 3.58%. These headwinds did not stop TFI from increasing total LTL shipments by 4.62%.
The division’s adjusted operating ratio was negatively impacted by lower revenue per shipment and lighter average loads.
Lean fleet to support truckload growth
Also, the strong revenue growth in Truckload should be considered against a very weak freight market in 2025 which impacted the year-over-year comparison.
Against this backdrop, the segment reported a 142.1 per cent rise in revenues. In a year-over-year comparison of the period, adjusted EBITDA for the segment grew 24.7% and operating income grew more than 90%.
It is noteworthy that these improvements took place with a significantly smaller operating fleet. TFI’s Truckload truck count was down approximately 12% year-over-year, with owner-operators down approximately 4.8%.
These figures show that the division is performing financially better while using less trucks and fewer independent operators.
TFI expects higher earnings in fourth quarter
Diluted earnings per share at the group level were $1.28, compared with $1.02 in the third quarter of last year.
TFI International anticipates this performance will improve further in the final quarter of the year. The company said it expects diluted EPS to be between $1.30 and $1.40 for the three months, indicating fourth-quarter earnings may be higher than the latest reported figure.
Investors and industry analysts can get a closer look at the numbers when TFI International holds an earnings conference call Friday at 9:30 a.m. Eastern Daylight Time (EDT).
Image placement: The image is roughly halfway through the article, following the Truckload operating income section.